Demystifying U.S. Covid-19 death counts and total excess deaths
What is the true death toll from Covid-19? Close analysis of CDC raw data suggests that a large majority of Covid-19 deaths were “borrowed” from other deaths categories like pneumonia, heart disease and cancer, mostly from nursing home populations; overall excess deaths are significantly less than CDC currently calculates; and their over-estimates are based on automated algorithms that don’t account for increased population and an aging population; and more excess deaths have occurred from policy choices than from the virus itself
“If you died of a clear alternate cause, but you had Covid at the same time, it’s still listed as a Covid death. Everyone who is listed as a Covid death, doesn’t mean that was the cause of the death, but they had Covid at the time of death,” Illinois’s director of public health, Dr. Ngozi Ezeke, explained to reporters in April, early in the pandemic.
She expanded on these definitions as follows:
“I just want to be clear in terms of the definition of ‘people dying of Covid.’ The case definition is very simplistic. It means, at the time of death, it was a Covid positive diagnosis. That means, that if you were in hospice and had already been given a few weeks to live, and then you also were found to have Covid, that would be counted as a Covid death.”
Oregon is similarly broad: “Deaths in which a patient hospitalized for any reason within 14 days of a positive COVID-19 test result dies in the hospital or within the 60 days following discharge.” An interview with KGW news about this definition, in an article entitled, “Are dying with COVID-19 and dying from COVID-19 the same thing? In Oregon, they are,” led to this statement from Oregon Health Authority spokesman, Fred Modie:
We asked Modie about a hypothetical case where someone died from a motorcycle crash and also had COVID-19. Would that be counted as a COVID-19 death?
“It would be,” Modie explained.
This is the approach used for tracking almost all U.S. Covid-19 deaths because each state tallies the death statistics in much the same manner, counting a “Covid-19 death” as any death associated with Covid-19 in any way, regardless of the actual cause of death.
CDC’s provisional mortality data describes the Covid-19 category as “all deaths involving Covid-19,” specifically not using language suggesting a causal linkage but only association.
This loose approach to deaths tracking is summed up well by Dr. Deborah Birx, the former White House Coronavirus Response Coordinator, in her statement that “if someone dies with Covid-19 we are counting that” as a Covid-19 death.
The U.S. Covid-19 death toll, those “involving” Covid-19, as reported by the CDC, stands at about 460,000 as of February 22, 2021. But we need to understand how this figure is derived in order to understand the true impact of the pandemic.
How many of these deaths are actually from the virus rather than only being associated with the virus, or “involving” the virus as the CDC puts it in the first column in Figure 1?
The short answer for those who don’t want to read the entire essay: a relatively small number of this total is actually “from” Covid-19, despite media coverage repeatedly mis-stating what the statistics show. My team estimates in our provisional work that as little as about 70,000 of these deaths are actually from Covid-19 and perhaps even less. I explain this number later in this essay.

CDC makes it clear that its provisional Covid-19 death count includes confirmed cases (requiring only a positive lab test result and not any symptoms at all) and presumed cases, in which not even a lab test is required for confirmation of the presence of the virus. (Footnote 1 to CDC’s key Table 1 for its provisional mortality data website states that the “All deaths involving Covid-19” category includes “Deaths with confirmed or presumed COVID-19, coded to ICD–10 code U07.1.”)
Presumed cases were more common early in the pandemic when tests were not as widely available. The large majority of cases tracked since the middle of 2020 are now “confirmed” with a lab test (how accurate these test results are is another serious issue that I cover in detail here). However, it’s still important to recognize that a significant number of CDC’s coded Covid-19 deaths were presumed rather than confirmed.
More generally, how can we best understand the apparently very high U.S. Covid-19 death toll? A close look at the CDC and state-level methodologies for counting deaths suggests that reported American deaths may be significantly overstated, not understated, as many observers have suggested.
Many U.S. states include in their Covid-19 death tally anyone who has tested positive for the virus at any time prior to death, and even people who were never tested but were merely suspected of having died from the virus — which is the “presumed” Covid-19 death category just discussed. And no causal link between the virus and the death is required. It is enough for the virus to be listed as a “contributing factor” on the death certificate, or to simply be presumed as a contributing factor, to be listed as a Covid-19 “involving” death.
Many of the victims listed as Covid deaths never had Covid-19 (the disease caused by the SARS-Cov2 virus) because about half of all positive tests are assumed to be asymptomatic carriers (CDC doesn’t actually cite data for asymptomatic carriers, just an assumption for its “best estimate” scenario; the percent of asymptomatic carriers is an active area of debate among scientists). And a large portion of those testing positive for the virus, if they had developed Covid-19, will have recovered from the disease by the time they die, since over 99.9% of people under 70 who get Covid-19 recover, and ~95% of people over 70 also recover.
But if these people die, after testing positive for the virus, from any of the many other causes of death that kill 50-60,000 people per week in the US (about 8,000 per day), they are still listed as a Covid-19 death because of the positive test result. I discuss this “borrowing” of deaths from other categories and counting them as Covid-19 deaths further below. This is a major part of understanding the true death toll from the virus.
The UK had a similar system as the US CDC, reporting any death as a Covid-19 death no matter how long ago the positive was, but in July 2020 changed the reporting guidelines to require a positive test or diagnosis within 28 days of death. But the new definition still had no required causal linkage between Covid-19 and the death. The net result of this change to the UK’s system was a reduction in reported deaths from Covid-19 by more than 5,000 (to 41,329, down from 46,706). A UK doctor explained the change: “The way we count deaths in people with COVID-19 in England was originally chosen to avoid underestimating deaths caused by the virus in the early stages of the pandemic.”
Alameda County did a similar down-count in June 2021, adjusting their deaths downwards 25%, from 1,634 to 1,223 in terms of deaths that could be either 1) attributed directly to the virus or 2) not ruled as a cause of death. In other words: their review found an extremely inclusive approach to tallying Covid-19 deaths wasn’t warranted.
This is a pattern we see across the pandemic surveillance chain: every link in the chain has been dialed up to be maximally sensitive and the result was a vast inflation of cases, hospitalizations and deaths, based on extremely inaccurate testing data being fed in at the beginning of the chain.
It is still not widely recognized that coronavirus tests are often highly inaccurate, with 90% or more effective false positives of various types, either in terms of inherent inaccuracies or in terms of how the tests are being used. The PCR test, considered the gold standard, is being used in such a way that up to 90% should be considered effectively false positives because of excessively high cycle thresholds that amplify a non-infectious (and thus not dangerous to anyone) sample to detectable levels.
The link is to an important meta-study (since published in the journal Clinical Infectious Diseases) by Jefferson et al., from the Oxford-based Center for Evidence-Based Medicine, which states: “A binary Yes/No approach to the interpretation of RT-PCR unvalidated against viral culture will result in false positives with segregation of large numbers of people who are no longer infectious and hence not a threat to public health.” My previous essay looked in detail at the test accuracy issues.
Early in 2020, the CDC changed the mortality reporting guidelines for death certificates to place a strong emphasis on reporting Covid-19 as a contributing or underlying cause of death in Part 1 of the death certificate — a major departure from the prior guidelines that had been in place since 2003. (I described these changes in detail in another essay).
This change in mortality reporting guidelines was perhaps the key policy change that led to a large inflation of the death count because it induced medical professionals to list Covid-19 as a cause of death in Part 1 of the death certificate even when it was more likely that a different issue was the actual cause of death.
And even if medical professionals didn’t do this themselves on the death certificate, CDC “codes” (that is, re-counts and re-interprets) all death certificates in creating its provisional mortality counts. Part of this coding process is ensuring that Covid-19 is tallied as the underlying cause of death whenever it is included as a cause of death, except in the rare number of cases where it was clearly something other than Covid-19 that led to the death at issue — a car accident or homicide, for example.
But — as suggested above in my discussion of Oregon — in this car crash example, even though CDC’s coding process will not consider Covid-19 to be the underlying cause of death in such a case (the car crash would be), it will still be listed as a Covid-19 death because of the positive PCR test result. In this case it’s talled as a “Covid-19 multiple cause of death” result rather than a “Covid-19 underlying cause of death.”
So, in sum, we have three major sources of inaccuracy when it comes to provisional counts of Covid-19 deaths: 1) extremely inclusive definitions of what counts as a Covid-19 death, including anyone who has had Covid-19 at any previous time whether or not the person died from the disease or something else, and including presumed cases, based on symptoms, that were not lab-confirmed; 2) many states go even further and include anyone who tested positive for the virus at any time and then died, whether or not they actually had Covid-19 or were an asymptomatic carrier, which is the case in about half of all cases; 3) often wildly inaccurate tests for the virus, which return 90% or more effective false positives in most circumstances, and form the start of the surveillance chain in terms of defining cases, hospitalizations and Covid-19 deaths.
If we adjust the ~460,000 deaths that CDC counted as 2020 “Covid-19-involving” deaths in light of these considerations, how does this number change? Answering this question requires that we examine CDC’s mortality data and excess deaths data in some detail. I’ll be confining my analysis to the 2020 deaths only because numbers since then are still not complete.
What about excess deaths?
What about excess deaths? Even if the various definitions and tests behind CDC’s provisional mortality data are highly problematic, as I’ve demonstrated, haven’t we still had a large increase in overall “excess deaths?” And doesn’t this strongly suggest that there’s still been a massive impact from Covid-19, even if the specific Covid-19 death toll is inflated by the issues just discussed?
Excess deaths numbers are widely accepted as probably the most important pandemic statistic. CDC defines excess deaths as follows (CDC MMWR Oct. 3, 2020): “Excess deaths are typically defined as the number of persons who have died from all causes, in excess of the expected number of deaths for a given place and time.”
For all of 2020, CDC tallied about 302,000 Covid-19 deaths, but total excess deaths were calculated at 440,000. This “excess deaths” figure means these deaths were over and above the 2015–2019 average number of deaths. (This is the figure at CDC’s excess deaths website when the “number of excess deaths” dashboard is selected). I‘m going to use this 440,000 excess deaths figure for all of 2020 for the starting point of my analysis.
CDC defines excess deaths, as just mentioned, as deaths in excess of expected deaths. So how are excess deaths calculated? It’s just the average of the 2015–2019 numbers, with some additional adjustments by CDC’s “Farrington flexible” algorithm. My team and I have been doing a deep dive into these models and their assumptions and we’ve found that it’s much more reasonable, based on past trends and the Baby Boomer “bulge” of increasing numbers of elderly people, to use a higher baseline than CDC uses, in keeping with the trendline of the last few years rather than dipping sharply, as CDC’s current baseline does. This adjustment of the baseline reduces the 440,000 figure to about 330,000 excess deaths for 2020. Figure 2 shows why.

In this discussion, it’s highly important to distinguish provisional Covid-19 deaths figures and the excess deaths figures. They can often be similar, but for our analysis we should keep them distinct in our minds and our calculations. Excess deaths aren’t necessarily caused by Covid-19, even though this is commonly assumed. Drs. Ezeke and Birx made that clear in the quotes above.
This is because excess deaths numbers, by themselves, say nothing about the cause of death. In fact, at least a third of US excess deaths for 2020 have a listed underlying cause of death other than Covid-19 (see Figure 4), and the real number is probably far more than this, due to the heavy stress CDC and other entities have placed on listing Covid-19 as a contributing or underlying cause of death, which I’ll discuss further below.
Figure 2 shows the excess deaths with and without Covid-19 from 2017 through the start of 2021 (source: CDC). The spike in the winter of 2017 and 2018 was a relatively bad flu and pneumonia year and gives an indication of how much more serious the current pandemic (at the right side of the chart) seems to have been than a bad flu season. Anything above the red line, which is the 5-year average of all deaths, is considered “excess deaths” and anything below it is considered “negative excess deaths.”

The non-Covid-19 excess deaths, which means those deaths were listed on death certificates as resulting from an underlying cause other than Covid-19, however, are a very large part of these excess deaths.
In fact, just the 13 causes of death that CDC currently includes in their “select causes of death” spreadsheet (see Figure 4) number a little under 1/2 (136,695 since Feb. 1, 2020), or about 44%, of the ~310,000 (adjusted for a more reasonable baseline) excess deaths.
This data does not, however, include additional spikes in overdose deaths, homicides and suicides, which have also been quite substantial in the pandemic. CDC has not yet completed an excess deaths analysis of these additional causes of death for 2020 yet and probably won’t do so until the end of 2021.
While we don’t have CDC’s full analysis yet we can calculate how many deaths they’re not including in their cause-specific excess deaths. 2020 saw about 3.2 million deaths from all causes. Only 2 million of these deaths are accounted for in CDC’s 13 select causes of death and Covid-19 calculations. This leaves about 1.2 million deaths from 2020 that are not included in CDC’s excess deaths analysis.
If we extrapolate the excess deaths for the 2 million that are included to the full 3.2 million we get about 219,000 excess deaths from all causes of death other than Covid-19. This is 71% of the 310,000 excess deaths figure.

However (a very big however), this is still not the full accounting of deaths that should be attributed to causes other than Covid-19 because CDC’s death reporting guidelines place heavy emphasis on reporting Covid-19 as a contributing factor or underlying cause of death, as discussed above, even if the medical professional reporting the death doesn’t list Covid-19 as the underlying cause of death.
The CDC coding process (see Part 2 of the NCHS instruction manual for details) that results in their provisional death counts adjusts the death certificate data to show Covid-19 as the single underlying cause of death in many cases where that is not the original conclusion on the death certificate. So state level and CDC policies have since the start of the pandemic heavily favored listing Covid-19 as the underlying cause of death.
CDC’s explanatory notes for data in Figure 4 state the following with respect to the underlying cause of death (emphasis added):
Estimated numbers of deaths due to these other causes of death could represent misclassified COVID-19 deaths, or potentially could be indirectly related to COVID-19 (e.g., deaths from other causes occurring in the context of health care shortages or overburdened health care systems). Deaths with an underlying cause of death of COVID-19 are not included in these estimates of deaths due to other causes, but deaths where COVID-19 appeared on the death certificate as a multiple cause of death may be included in the cause-specific estimates.
This passage is a key piece of information because it demonstrates that CDC’s excess deaths data is double counting deaths in a significant number of cases. We will examine further below specifically how many of these deaths appear to be double-counted, and it is substantial.
The explanatory note continues:
For example, in some cases, COVID-19 may have contributed to the death, but the underlying cause of death was another cause, such as terminal cancer. For the majority of deaths where COVID-19 is reported on the death certificate (approximately 95%), COVID-19 is selected as the underlying cause of death.
This language is worded confusingly, but the key part is the last sentence and it says that “approximately 95%” of death certificates that include Covid-19 on the death certificate have Covid-19 reported as the underlying cause of death, rather than only as a contributing factor or a multiple cause of death. Again: this is partly the result of CDC’s own coding process and its instruction manual requiring that Covid-19 be listed as the underlying cause of death in the large majority of deaths.
Taking this data on face value we see that well over half of all U.S. excess deaths so far this year may have been caused by things other than the virus, with circulatory/heart diseases and Alzheimer’s/dementia being the two categories with by far the most excess deaths, as Figure 4 shows.
Long-term care deaths account for about half of all excess deaths
It is not an accident that both of these categories, circulatory diseases and Alzheimer’s/dementia, overwhelmingly affect old people and, in particular, long-term care residents. In fact, we can look to long-term care homes alone to explain a large number of the ~137,000 excess deaths attributed to causes other than Covid-19 (as discussed in the previous section).
As of Feb. 3, 2020, over 152,000 Covid-19-related deaths have occurred in long-term care facilities, according to data collected by the New York Times in Figure 5. This is equivalent to about half of the 310,000 excess deaths we calculated above.
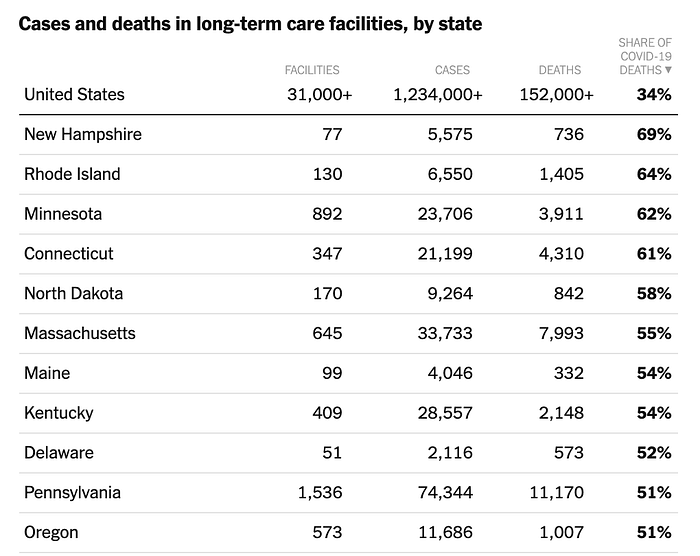
It’s a sad fact that half of U.S. nursing home residents die within five months from taking up residency— in normal times — which means that a substantial number of these deaths that have been counted as Covid-19 deaths have probably been due to normal causes and not the virus. Pneumonia, heart disease, cancer, respiratory disease, and many of the other causes of death in Figure 3 afflict nursing home residents in high numbers.
Another significant cause of death for the elderly and particularly in nursing homes, even in normal times, is social isolation and consequent loneliness and loss of will to live, which is a bigger killer than obesity and air pollution for this demographic. These forces have been massively exacerbated by the coronavirus pandemic and resulting social distancing and lockdown policies that have prevented long-term care residents from seeing family or friends, or even having any form of contact at all in many cases. (I wrote a previous essay on this issue here, and I’ve updated my numbers in the present essay).
1.3 million Americans lived in nursing homes, according to the CDC, and another 1.7 million in other long-term care facilities (see slide 8 in the linked CDC presentation), for a total of about 3 million in long-term care facilities. Five months is the median time before death in this population in normal times; the average is longer because some patients last far longer before succumbing. 65% die within one year of admission.
That’s during normal times, pre-pandemic.
Half of this 1.3 million nursing home population would have died in normal times within five months, equaling approximately 0.65 million deaths. And approximately all residents will die, on average, within ten months (two times the median death time; this holds true only if the population is turning over in a normal manner and 2020 appears to have been a far higher than normal turnover year, as discussed in my essay focused on long-term care deaths).
Ten months is approximately the time it’s been since the pandemic hit the U.S. in force in early 2020.
As we’ve seen, the U.S. is counting in its official statistics not only those people who die “from” Covid-19, but also those who die “with” Covid-19, based on CDC guidelines encouraging known and “probable” Covid-19 deaths to be listed.
When we compare the approximately 152,000 long-term care deaths attributed to Covid-19 (either “from” or “with” Covid-19, because the data available don’t distinguish these key details) we see that there would be about 8.5 times that many deaths (1.3 million divided by 152,000 = ~8.5) from all other causes in the long-term care population during normal times.
It is not difficult to see how the U.S. could be significantly over-counting Covid-19 deaths through re-classification of the cause of death because we have an 8.5:1 higher normal death rate in normal times as compared to the reported long-term care death rate that is being attributed to Covid-19. As discussed below, CDC has expressly stated its practice since April of including pneumonia in the Covid-19 deaths category because of concern that deaths coded as pneumonia may in fact be due to Covid-19 as the underlying cause.
In other words, during the time that we have seen approximately 152,000 long-term care deaths associated with Covid-19 we would in normal times have seen about 1.3 million deaths from all causes among the nursing home population and far more in the 3 million-person long-term care population as a whole.
It may still be the case, however, that a large number of the nursing home Covid-19 deaths did in fact result “from” the virus, rather than other causes. But it seems likely that many of the deaths, perhaps most, associated with Covid-19 would have happened anyway, from other causes. We are led to this conclusion when we consider the five-month normal median survival time for long-term care patients, plus the fact that the average “additional conditions or causes per death” in U.S. Covid-19 deaths has been 3.8, according to the CDC.
It is also very likely that a significant number of the increased Alzheimer’s/dementia deaths we have seen are due as much or more to increased isolation and loneliness in long-term care homes and elder populations more generally, than from the virus itself, a conclusion that the New York Times highlighted in an editorial in late December 2020:
Let’s now look closer at the CDC excess deaths data in light of these considerations.
A closer look at CDC’s excess deaths tracking methodology
As mentioned above it’s important to keep total deaths and excess deaths figures distinct. Excess deaths refers to the estimated number of deaths above the previous five-year average numbers of deaths (CDC sometimes uses a three-year average instead).
I mentioned above that CDC calculated as of Jan. 1, 2021, a range of 316,252–431,792 excess deaths since Feb. 1, 2020. It’s not entirely clear where these figures come from because CDC does not describe in sufficient detail how these figures are determined. However, I will use the figures CDC states at the top of this dashboard chart, in red, as follows.

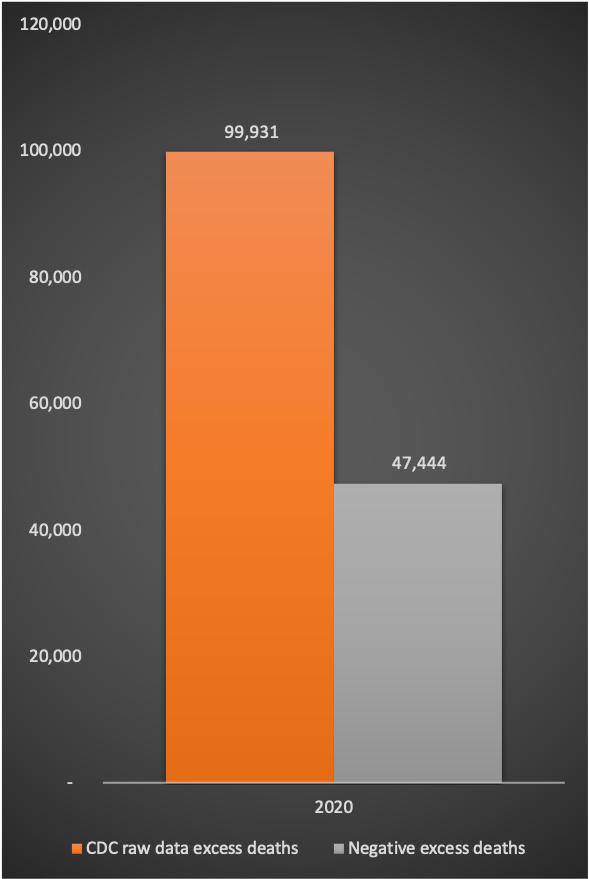
The summary of my somewhat lengthy analysis below of CDC’s excess deaths methodology is that CDC’s own raw data show about 100,000 excess deaths for 2020 — much less than the range just stated. (The exact figure is 99,931 excess deaths). If we use the middle of the range for the stated excess deaths figures above, about 370,000, we need to explain how CDC got from the ~100,000 raw data excess deaths figure to the stated ~370,000, which is a discrepancy of about 220,000 excess deaths.
Let’s first look at CDC’s 100,000 weighted excess deaths figure.
CDC’s downloadable spreadsheet, “Weekly counts of death by jurisdiction and cause of death,” is the basis for my calculation of the 99,931 excess deaths, which is based on weighted/estimated figures in the spreadsheet. Simply summing column M, the weighted excess deaths figures for each category, in this spreadsheet adds up the weekly excess deaths estimates, but this total must be divided by two because each state is represented in this very large spreadsheet (over 300,000 lines of data) as well as the US as a whole in the same spreadsheet. (Contact me if you’d like me to walk you through exactly how I calculated all of my figures).
It seems that the large majority of these excess deaths can be explained by the excess deaths we’ve seen from long-term care facilities, as discussed above, which totaled about 106,000 as of Dec. 4, 2020, based on the New York Times calculations, many of which are from causes other than Covid-19.
Figure 7 shows my calculations so far. We still need to account for about 220,000 apparent excess deaths if we are to explain the discrepancy between the CDC’s headline excess deaths and the excess deaths that their own raw data show.

The ~220,000 deaths discrepancy can be explained through three things: 1) re-classification of deaths, by CDC and each state, as Covid-19 deaths, primarily from long-term care facilities; 2) the CDC spreadsheet is incomplete in terms of all causes of death, omitting non-natural cases like overdoses, suicides, homicides, and accidents; 3) the third major explanation is an artifact of CDC’s surveillance algorithm (an automated/computerized tracking system designed to identify disease outbreaks as early as possible) that over-estimates net excess deaths figures. These two items reduce the actual tallied excess deaths so far to about 100,000 — a still considerable figure but far less than the ~320,000 deaths that CDC’s dashboard shows.
I’ll go through each of these parts of the explanation in the following discussion.
With respect to all three parts of the explanation, no malfeasance is being suggested here. It is more likely that strong pressure from the CDC mortality reporting guidelines (which were significantly changed early in 2020) as well as extreme media attention on the pandemic is what led to significant mis-attribution of deaths to Covid-19 rather than the more likely existing comorbidities, or what CDC calls “additional conditions or causes of death.”
We shouldn’t forget that CDC has calculated an average of 2.9 comorbidities for 94% of all Covid-19 deaths. This means that there have been an average of about three other causes of death listed on each of the 94% of Covid-19 death certificates that include more than Covid-19 as a cause of death.
In other words, CDC seems to be “borrowing” large numbers of deaths from other deaths categories and calling them Covid-19 deaths, and then it is adding these deaths on top of the existing deaths categories, effectively double- or triple-counting these deaths.
I quoted CDC technical notes above on this issue but I’ll quote it again here because it’s a key part of the puzzle of what’s going on: “[D]eaths where COVID-19 appeared on the death certificate as a multiple cause of death may be included in the cause-specific estimates.” “Cause-specific estimates” refers to the 13 categories of deaths that CDC added to its excess deaths tracking in June 2020. This is the explanation for CDC’s apparent double-counting of deaths in its excess deaths data.
It’s already clear from visually inspecting the CDC data that there is something awry with deaths reporting in 2020 because we are not seeing the normal peaks in most causes of death that we see during a seasonal peak. Here is the 2014–2020 CDC (NCHS) all causes of death data displayed in a single chart (this is provisional mortality data, not excess death data, but provisional mortality data forms the basis for excess deaths analysis).

As the notes on the figure show, we see strong peaks in flu and pneumonia (ILI), chronic lower respiratory disease, and Alzheimer’s during past seasonal peaks in excess deaths. If we now look more closely at the right side of the chart, 2020, as shown in Figure 8 (this is, again, provisional mortality data not excess deaths data), we see that the expected peaks in other causes of deaths are mostly absent.
Only heart disease shows much of a peak in the spring of 2020, which is when Covid-19 became prevalent in the US, and also much lower peaks for flu/pneumonia, diabetes and Alzheimer’s. None of these categories peak at all during the summer peak, except for the “other” category, which did rise significantly and is defined as symptoms and signs “not elsewhere classified,” basically a catchall category where other diagnoses are not justified. It’s not clear what that diagnosis(es) is from the data provided, but it is a considerable sum, reaching 4,000 per week by the end of the year.

It seems clear that much of this “borrowing” is CDC tallying Covid-19 death certificates with multiple causes of death in each of the categories listed, effectively double-counting or more. In fact, when we consider the average of 2.9 causes of death other than Covid-19 that are listed on 94% of Covid-19 death certificates we realize that CDC is actually triple and quadruple-counting in the large majority of cases.
Let’s dig a bit deeper into the excess deaths data now, rather than the provisional mortality data that we looked at in Figures 7 and 8. To do that, we need to look further into how the CDC chart in my Figure 2 is produced by CDC. There are various types of data adjustments being made by CDC in producing this chart, explained by CDC’s “technical notes” below the chart.
CDC uses two primary steps in deriving excess deaths estimates:
- Weighting of provisional data based on five-year averages for expected deaths in that week for each category. “Weighting” means adjusting the provisional data up or down based on expected deaths for that week, using the five-year average as the baseline and adjusting for population changes, using “overdispersed Poisson generalized linear models with spline terms to model trends in counts,” as CDC describes at its website. These are estimates and subject to change over time.
- When a negative excess deaths figure for a particular week is estimated (due, for example, to fewer flu deaths in any week when compared to the five-year average), CDC changes these negative values to zeros in calculating the net excess deaths for each category in each jurisdiction. CDC explains that it does this in order to avoid missing potential outbreaks that might otherwise be masked by negative excess deaths values.
When we look into the effect of these adjustments, we see that a significant part of the excess deaths that CDC calculates has happened in 2020 seems to. be an artifact of this method for calculating excess deaths, what is known as the Farrington surveillance algorithm, which substitutes zeros for negative numbers until more than a year has passed (“typically 12 months after the close of the data year”), at which time the zero is replaced with the actual numbers, which may in some cases still be negative numbers for excess deaths.
(Some scholars state that CDC use the EARS designation for their system, e.g. Noufaily, et al. 2019 “Comparison of statistical algorithms for daily syndromic surveillance aberration detection,” but CDC’s own materials state they use the Farrington algorithms, modified in some cases.)
While CDC changes negative values for most causes of death to zeros, Covid-19 deaths (ICD U07.1) are all counted as positive excess deaths (not zeroed out) because there is no prior year record to compare these to as “excess deaths.”
The net result of this algorithm is that declines in many categories of excess deaths are not captured in the summed data but the apparent increase in deaths from Covid-19 are captured.
When we look at the raw data for excess deaths in categories other than Covid-19 those negative excess deaths reduce the net increase in deaths attributed to Covid-19 by about half of the total. This artifact of CDC’s reporting process will only be trued up, and become known as an artifact, when CDC updates its negative excess deaths figures “typically 12 months after the close of the data year.”
Summing up the negative values that are turned into zeros by CDC’s algorithm yields a net ~47,000 fewer excess deaths. (This is fairly easy to do if you sort the data by Column M, with rising values, and just sum the negative numbers together.) See Figure 9.
So let’s unpack the CDC’s notes on its methodology to shed some more light on how this zeroing-negative-values artifact appears to have come about. CDC’s “technical notes” for its excess deaths data state (emphasis added):
This method is useful in detecting when jurisdictions may have higher than expected numbers of deaths, but cannot be used to determine whether a given jurisdiction has fewer deaths than expected given that the data are provisional. Provisional counts of deaths are known to be incomplete, and the degree of completeness varies considerably by jurisdiction and time. Incomplete data in recent weeks can contribute to observed counts below the threshold. Thus, the estimates of excess deaths — the numbers of deaths falling above the threshold — may be underestimated. While reported counts are weighted to account for potential underreporting in the most recent weeks, the true magnitude of underreporting is unknown. Therefore, weighted counts of deaths may over- or underestimate the true number of deaths in a given jurisdiction.
This passage stresses the possibility that provisional death counts may be less than the actual count for Covid-19 deaths, but also highlights that the methodology “cannot” be used to determine when there are fewer excess deaths (as opposed to more excess deaths) in a jurisdiction or any specific category. This is because, as stated, CDC’s ongoing excess deaths estimation places a zero in a category as its lowest possible value, not a negative number. This is a modification of the Farrington surveillance algorithm (Farrington et al. 1996), as the technical notes describes.
But what if there are, for example, lower than expected car accident deaths because of lockdowns or people voluntarily staying home? This excess deaths number will obviously be far lower than zero for 2020, but the CDC’s methodology will not capture it until a year or more after the fact. Or fewer heart attacks and respiratory disease, for example?
The next (long) note explains how CDC’s excess deaths estimates work. I’ve broken the note into shorter paragraphs for ease of reading, and added my own explanation for each paragraph in brackets at the end of each paragraph (emphases added).
Estimates of excess deaths for the US overall were computed as a sum of jurisdiction-specific numbers of excess deaths (with negative values set to zero), and not directly estimated using the Farrington surveillance algorithms. Summation (rather than estimation) was chosen to account for the possibility that some jurisdictions may have substantially incomplete data while other jurisdictions report may [sic] more deaths than expected, these negative and positive values will cancel each other out when estimating excess deaths for the US directly using the Farrington surveillance algorithms. [This paragraph explains how CDC is not using the normal Farrington algorithm estimation process (Farrington et al. 1996), but is instead using a summation process that uses a zero value for all negative values in the raw data, which is a modification of the Farrington algorithm]
Until data are finalized (typically 12 months after the close of the data year), it is not possible to determine whether observed decreases in mortality using provisional data are due to true declines or to incomplete reporting. Thus, when computing excess deaths directly for the US, negative values due to incomplete reporting in some jurisdictions will offset excess deaths observed in other jurisdictions. [This is further explanation of why zeros are used rather than the negative values from the provisional data, in order to not drown out any possible outbreak signal with negative excess deaths in some jurisdictions. The price paid may be erring too much on the side of caution in terms of showing too many excess deaths than are really occurring]
For example, the total number of excess deaths in the US computed directly for the US using the Farrington algorithms was approximately 25% lower than the number calculated by summing across the jurisdictions with excess deaths. This difference is likely due to several jurisdictions reporting lower than expected numbers of deaths — which could be a function of underreporting, true declines in mortality in certain areas, or a combination of these factors. [This explains how the summation process CDC is using leads to a ~25% higher excess deaths estimate than the normal Farrington algorithm, again due to the choice of placing a zero rather than using negative values]
In addition, potential discrepancies between the number of excess deaths in the US when estimated directly compared with the sum of jurisdiction-specific estimates could be related to different estimated thresholds for the expected number of deaths in the US and across the jurisdictions. [Explaining another possible reason for differences between the normal Farrington method and the modified method adopted by CDC]
The CDC technical notes make the point, about inserting a zero value rather than negative values from provisional data, twice more in their technical notes, as follows: “Negative values, where the observed count fell below the thresholds, were set to zero.” And then, again (emphasis added):
The total count of deaths above average levels are shown for select causes of death. These totals are calculated by summing the number of deaths above average levels (based on weekly counts from 2015–2019) since 2/1/2020. Negative values were set to zero and therefore excluded from these sums.
CDC adds as a final note on its excess deaths methodology:
Finally, the estimates of excess deaths reported here may not be due to COVID-19, either directly or indirectly. The pandemic may have changed mortality patterns for other causes of death. Upward trends in other causes of death (e.g., suicide, drug overdose, heart disease) may contribute to excess deaths in some jurisdictions. Future analyses of cause-specific excess mortality may provide additional information about these patterns.
This note acknowledges what my Figure 2 and 3 above indicate in the already-gathered data: a large proportion of excess deaths are from non-Covid causes. And as we learn more about the various pressures and financial incentives for doctors and hospitals to list Covid-19 as a contributing or underlying cause of death on death certificates, and engage in serious re-analysis of death certificates, we may see states’ and CDC’s data on Covid-19 deaths change substantially.
In closing, it appears that CDC’s choice of data collection and excess deaths surveillance has led to a significant over-count of excess deaths by failing to account for negative excess deaths in many categories, which, when they are accounted for, reduce the raw data total excess deaths to about 100,000, down about 70% from the 320,000 CDC dashboard excess deaths figure.